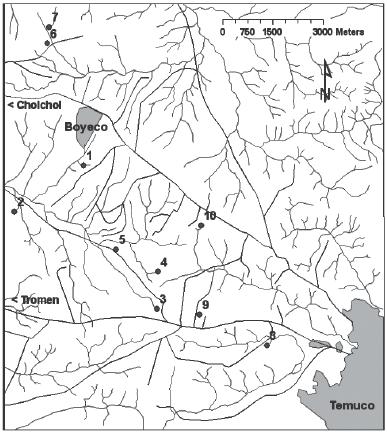
Figura 1. Ubicación de las lagunas estudiadas en las cercanías de Temuco (Araucanía, Chile). Líneas grises: arroyos y desaguaderos. Líneas negras: calles y caminos.
AGRO
SUR 37(1) 9-25 2009
DOI:10.4206/agrosur.2009.v37n1-02
ARTÍCULOS ORIGINALES
FLORISTIC COMPOSITION OF ANTHROPOGENIC SEASONAL WETLANDS IN THE COASTAL MOUNTAIN RANGE OF CAUTIN, CHILE
Composición florística de lagunas temporales antropogénicas en las montañas costeras de Cautín, Chile
Cristina San Martín 1, Miguel Alvarez 2
1
Instituto de Botánica, Facultad de Ciencias, Universidad Austral
de Chile, Casilla 567, Valdivia, Chile.
2 INRES, Geobotanik und Naturschutz, Rheinische
Friedrich-Wilhelms-Universitaet, D-53115 Bonn, Germany.
ABSTRACT
Secondary anthropogenic temporary wetlands are formed in seasonally flooded landscape depressions in the mountainous region of Tromen (Region Araucanía, Chile). We sampled 80 plots of 25 m2 distributed between 10 seasonal wetlands, estimating the cover of plant species in each plot. We analysed the taxonomic composition, status and life-forms of the flora and compared the species composition of the wetlands through classification (hierarchical clustering) and ordination (nMDS) analyses. The floristic composition of the wetlands was very heterogeneous. Their species richness was not correlated or other their area size or their community composition. The high importance of introduced plant species and the low number of ephemeral wetland specialists in the studied flora (only 9 specialists of 87 species) confirmed the secondary character of the studied wetlands. The effects of disturbance on the seasonal wetland flora are also discussed.
Keywords: Ephemeral wetland vegetation, vernal pools, aquatic plants, life forms.
RESUMEN
Lagunas efímeras se han formado secundariamente en depresiones inundadas estacionalmente en la región montañosa de Tromen (Región de la Araucanía, Chile). En este trabajo se levantaron 80 censos vegetales en parcelas de 25 m2 distribuídas en 10 lagunas temporales, estimando visualmente la cobertura de las especies en cada parcela. Se analizó la composición taxonómica, origen y formas de vida de las especies vegetales y se comparó la composición florística de las lagunas a través de análisis de clasificación (clusters jerárquicos) y de ordenación (nMDS). La composición florística de los humedales resultó ser muy heterogénea, mientras que su riqueza en especies no se correlaciona con su superficie ni con la cantidad de comunidades vegetales presentes en cada uno de ellos. La alta importancia de las especies introducidas y la baja participación de especialistas de lagunas efímeras (sólo 9 especies de 87) en la cubierta vegetal confirman el carácter secundario de los humedales estudiados. También se discuten los efectos de la alteración en la flora de lagunas temporales.
Palabras clave: vegetación de lagunas temporales, humedales, plantas acuáticas, formas de vida.
INTRODUCTION
The region of Temuco was originally covered with native forests. In the uplands these forests were partially deciduous with some sclerophyllous elements, while in the lower areas and near the rivers they were dominated by evergreen elements (Ramírez et al., 1989). This original forest vegetation was destroyed during the colonization of this region (Ramírez et al., 1988, Otero 2006).
Originally swampy myrtaceous forest grew in the landscape depressions that were seasonally flooded (Ramírez et al., 1983). After the deforestation, those depressions became seasonal wetlands: wetlands that are flooded in winter by seasonal rainfall and small streams, but are completely dry during the summer (Deil 2005). The dry periods, over the last few years, have become extended, due to low rainfall and the infilling of the wetlands with sediment.
In Chile, there is little knowledge concerning the flora and ecology of seasonal wetlands. Published studies are restricted to first observations by Oberdorfer (1960), a preliminary survey of the flora and the distribution of vernal pools by Bliss et al., (1998) and some regional investigations in Southern Chile (Ramírez et al., 1994, San Martín et al., 1998, Alvarez 2008). Throughout the world, seasonal wetlands are important ecosystems due to the presence of many palaeo and neo endemics (both plants and animals) and because of their vulnerability (Grillas et al., 2004, Deil 2005).
The aim of this research was to answer the following questions:
1)
How important is wetland size in the determination of its species richness?
2) Do the foristic similarities between wetlands depend on their isolation?
3) Are there correlations between diversity and disturbance as estimated
through biological indicators such as life-forms and the species status?
We expect a positive correlation between the area of the wetlands and their species richness following the predictions of the island biogeography hypothesis (MacArthur y Wilson 1967). Seasonal wetlands are normally fragmented ecosystems and the plant species that grow in them have adaptations to restrict their dispersal (Zedler 1990, Alvarez 2008). Therefore, a negative correlation between the similarity and the distance between wetlands is expected. Finally a correlation between the disturbance level and the species richness is expected. In addition, the importance of introduced species for the species richness of the wetlands will be discussed.
MATERIAL AND METHODS
Study site
The study site lies in the mountainous region of Tromen, to the west of Temuco (Figure 1). Most of the studied wetlands are located within the indigenous reserves of the Mapuche, who live in a precarious socio-economic situation and practice extensive, traditional agriculture. Because of the land-use history: extensive deforestation followed by intensive grain cultivation at the end of the 19th century (Berninger 1929, Otero 2006), the soils have been seriously degraded by erosion.
All of the wetlands but one are flooded seasonally during the winter and subject to drought during the summer. Wetland number 8 on the farm 'Fundo Carmen Chico', belongs to descendants of German colonists, and is the only one with permanent water due to a dyke and the shading of surrounding trees. However, in the autumn 1999 after this study was concluded, this wetland was drained for construction work.
The soil in this area is classified as "red-loam type" and belongs to the Metrenco serie (Besoain 1985). It is considered to be a very heavy soil and difficult to cultivate. Opportunities for cultivation are restricted to a few weeks in the year, because of the drought in summer and the excess of soil moisture in winter. Soil erosion is widespread and constantly fills the bottom of landscape depressions with sediment.
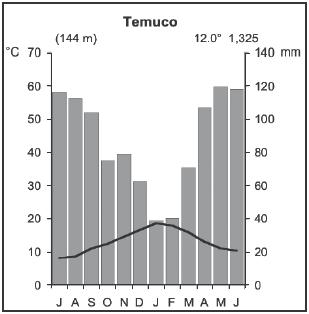
According to the classification of Rivas-Martínez (1993), the climate belongs to the humid mesotemperate type (Amigo y Ramírez 1998). The annual rainfall reaches about 1,400 mm and the mean temperature is 12° C (di Castri y Hajek 1976). Rainfall is abundant in winter, and in summer there is a dry period of between one and three months (Figure 2). The natural vegetation is a subtropical semideciduous forest type (Schmithüsen 1956, Ramírez et al., 1998).
 |
Figure
2. Climate diagram of Temuco. After Hajek y di Castri (1975). Figura 2. Climodiagrama de Temuco. según Hajek y di Castri (1975). |
Data sampling
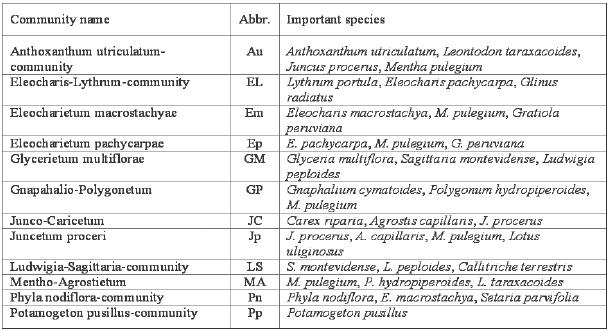
During the spring and summer of 1997 and 1998, 80 vegetation samples were taken from ten wetlands. The samples, 25 m2 in size, were divided into stands of different communities (Table 1), including aquatic, limnic and terrestrial phases (Pott y Remy 2000). For each sample, the cover of the plant species was estimated (Dierschke 1994). A detailed description of the communities was presented by San Martín et al., (1998) and Hauenstein et al., (2002).
 |
Nomenclature of the specific taxa was based on Marticorena y Quezada (1985), and the family classification on Woodland (1991). Specialist literature was used to determine the classification of the rushes (Kirschner 2002) and the European plant species (Tutin et al., 1996). The author abbreviations in the appendix follow the proposal of Brummitt y Powell (1992).
Data analysis
Constancy percent and relative cover of each species was calculated. The importance value was calculated as the mean value of these indices (Ramírez et al., 1997). Spectra according to the status and the life-forms of the sampled species were drawn. The information about the status of the species was obtained from Marticorena y Quezada (1985) and Matthei (1995). The life-forms were determined according to Raunkiær's classification using the key of Ellenberg y Mueller-Dombois (1966). A further ecological classification of the plant species follows Sculthorpe (1967) and Zedler (1990). The floristic composition of the wetlands was assessed at the species, genus and family level using taxonomic diversity profiles (Feoli y Scimone 1984).
Single and multiple linear regressions were carried out to assess models of the wetland species richness versus wetland area and the number of present communities. The data were all Log transformed (log 10). The phytosociological reference for the communities was that described by San Martín et al., (1998) and Hauenstein et al.,(2002). The correlation between beta diversity (pair wise comparison of the floristic composition using the Jaccard index; Jaccard 1912) and the distance between wetlands was also determined.
The foristic composition of seasonal wetlands was classified by hierarchical clustering with the complete linkage algorithm and the Jaccard index as the similarity measure (Leyer y Wesche 2007).
For an ordination analysis, a matrix with the importance value of each species in each wetland was arranged. Then a distance matrix was calculated using the Bray-Curtis-index (Bray y Curtis 1957). Finally a non-metric multidimensional scaling (nMDS) with two dimensions was carried out (Kruskal 1964). To compare the ordination axes with the proportion of therophytes, hemicryptophytes and introduced species post-hoc, Poison correlations were carried out (Leyer y Wesche 2007). These proportions were used as disturbance indicators, based on the dominance of introduced species in secondary grassland communities of Southern Chile, the pioneer character of the therophytes (most of them also adventives) and the adaptation of hemicryptophytes to grazing and trampling (Hauenstein et al., 1988, Ramírez et al., 1991). The community composition of the wetlands was also compared with the ordination diagram, but using the Spearman rank-correlation. Both community composition and proportion of disturbance indicators were included in the ordination plot through a linear regression with the nMDS-dimensions (Leyer y Wesche 2007).
All above-mentioned analyses were performed using the software R version 2.8 (R Development Core Team 2005) including the packages vegan, cluster and simba.
RESULTS
Taxonomic diversity of flora
In total 87 plant species belonging to 71 genera and 35 families were sampled (Table 2). The class with the highest number of species was Magnoliopsida (dicotylendons) with 55 species (about 63 % of the total number), 32 species (37 %) belonged to the class Liliopsida (monocotyledons). A total of 52.9 % of the total plant cover were monocotyledons. No ferns were found in these wetlands.
 |
The families with the greatest representation were Poaceae with 14 species in 14 genera and Asteraceae with 12 species in 11 genera, 16 and 14 % of the total species number, respectively. The most common families of the Magnoliopsida after Asteraceae were Polygonaceae (6 species in 3 genera), Apiaceae (4 species in 3 genera), Scrophulariaceae (4 species in 4 genera) and Fabaceae (3 species in 2 genera). For the Liliopsida, the families Cyperaceae (7 species in 4 genera) and Juncaceae (6 species, all in the genus Juncus) followed the grasses in order of importance.
Mentha pulegium, an introduced chamaephyte, was the most important species in the vegetation samples (Table 3). This species grows in wet grasslands and colonizes the borders of the wetlands. A total of 14 plant species were present in more than 10 samples, including 7 introduced species (Agrostis capillaris, Leontodon taraxacoides, Lotus uliginosus, M. pulegium, Phyla nodifora, Polygonum hydropiperoides and Rumex conglomeratus) and 7 native species (Centipeda elatinoides, Cyperus refexus, Eleocharis macrostachya, Eleocharis pachycarpa, Gnaphalium cymatoides, Gratiola peruviana and Juncus procerus), most of which were hemicryptophytes.
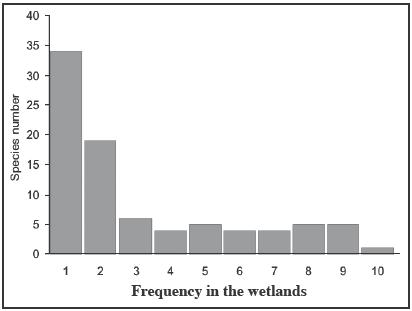
More than a 60 % of the species were found in only 1 or 2 wetlands (Figure 3). Only 1 species (Polygonum hydropiperoides) was found in all 10 wetlands. Five species occurred in 9 wetlands: Eleocharis pachycarpa, Gratiola peruviana, Juncus procerus, Mentha pulegium and Phyla nodifora, of those the last two species are introduced. Agrostis capillaris, Centipeda elatinoides, Cyperus refexus, Leontodon taraxacoides and Lotus uliginosus were present in 8 wetlands, of those only C. elatinoides and C. refexus are native. Eryngium pseudojunceum, Glyceria multiflora, Gnaphalium cymatoides and Rumex conglomeratus, were present in 7 wetlands, and all are natives except the last one. Eleocharis macrostachya, Hypochaeris radicata, Juncus microcephalus and Spergularia rubra were only found in 6 wetlands.
 |
Figure
3. Frequency histogram of the species in the wetlands near Temuco. Figura 3. Histograma de frecuencia de las especies en las lagunas de las cercanías de Temuco. |
Life-forms and status of the species
From the sampled species, 45 (51.7 %) are native and 42 (48.3 %) are introduced (Table 4). With respect to the cover values, the native species account for 54.5 % of the total cover.
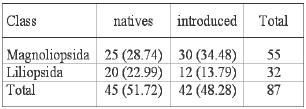 |
| Percentage in parentheses |
The most abundant life-form was the hemicryptophytic with 39 species, representing about 45 % of the total (Table 5, Figure 4). This life-form was abundant on the banks of the wetlands and the higher surrounding areas. The second most important life-form were the therophytes (annual herbs), represented by 23 species (26.4 %). They colonize the innermost part of the wetlands. The cryptophytes (perennial herbs with underground survival organs) were represented by 15 species (17.2 %) and the other life-forms present include hydrophytes (aquatic plants), helophytes (swamp plants) and one geophyte (the bulb herb Sisyrinchium gra-minifolium). Both hydrophytes and helophytes grow along the shores and in the shallow water of the wetlands. Chamaephytes (perennial herbs and dwarf scrubs with shoot apexes close to the soil surface) and phanerophytes (all other woody plants) were the most scarce life-forms with 6 and 4 species, respectively. Taking cover values into account, the proportion of hemicryptophytes was the greatest (63.5 %), followed by chamaephytes, cryptophytes, therophytes and phanerophytes, in decreasing order of importance (Table 5).
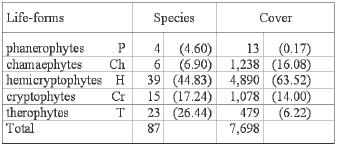 |
| Percentage in parentheses |
Separating the native species from the introduced species, about 70 % of the therophytes are introduced, whereas cryptophytes and hemicryptophytes are predominantly native species (Figure 4).
The biological spectrum (Figure 5) corresponds to the therophitic phytoclimate typical of the northeast region of Central Chile (San Martín y Ramírez 1986). In the studied wetlands this biological spectrum was more developed in the dry summer months (during the terrestrial phase sensu Pott y Remy 2000). In the wettest season (winter and spring) perennial life-forms of hemicryptophytes, hydrophytes and helophyes (cryptophytes) become dominant. The therophytes were only found in the terrestrial phase, whereas the hemicryptophytes and cryptophytes were found throughout the year. A similar seasonality was found in Southern Chilean grasslands by Ramírez (1984).
Comparing the species list of this work with those of Ramírez et al. (1983), 9 species of the native flora and 12 of the introduced flora have an affinity with the myrtaceous swamp forest, which originally grew in these wetlands. On the other hand, typical ephemeral wetland species are not very important, taking as a reference the works of Ramírez et al. (1994), Bliss et al. (1998) and Alvarez (2008). About 49 % of the total sampled species (43 species) were terrestrial plants belonging to dry locations (Table 6). Swamp plants comprised 41 % (36 species) of all collected plants. Aquatic plants accounted for only 9 % (8 species) of the flora, of which 5 are submerged plants (Myriophyllum aquaticum, Utricularia gibba, Limosella australis, Crassula peduncularis, and Potamogeton pusillus) and 2 were floating leaved species (Ludwigia peploides, Callitriche palustris and Callitri-che autumnalis). These water plants (almost the aerial parts) disappear in the dry seasons. Using cover values as a measure, helophytes accounted for 70 % of the vegetation and 50 % according to the total species number. This confirms the importance of the swamp flora along the wetland shores and the seasonality of these habitats, which represent amphibious ecosystems alternating very wet periods with very dry ones (Deil 2005, Chambers et al., 2008).
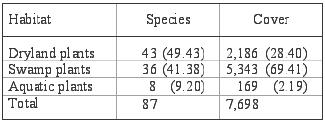 |
| Percentage in parentheses |
Of the 87 species that formed the flora of the studied wetlands, only 9 (10.34 %) were obligate ephemeral wetland plants (Zedler 1990). Eight were dicotyledons and one (Juncus stipulatus) was a monocotyledon, all of which were native species, the hemicryptophytes Centipeda elatinoides, Eryngium humifusum, Eryngium peudojunceum and Phyla nodifora, the therophytes Glynus radiatus, Gnaphalium cymatoides, Navarretia involucrata and Juncus stipulatus, and the cryptophyte Lythrum portula. The majority of these are small and colonize the central zone of the wetlands which are dry in summer. The most important was Phyla nodiflora, which was present in 9 wetlands and had an importance value of 18.38. The next highest in importance were Gnaphalium cymatoides (7 wetlands, importance value 14.38) and Centipeda elatinoides (8 wetlands, importance value 12.36). It is possible that these ephemeral wetland specialists are dispersed from the native micro vernal pools present in the neighbourhood and described by Ramírez et al., (1994).
The vast majority of the wetland flora were dry land plants or wetland generalists (in both cases 39 species, corresponding to 44.8 % of the total species number).
Plant diversity of the studied wetlands
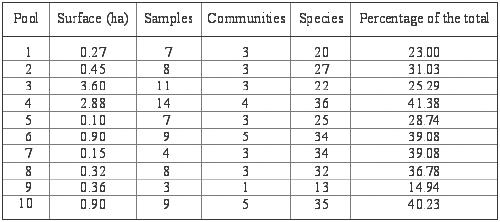
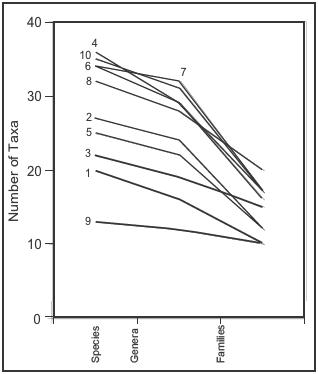
A first analysis of the plant species diversity of the wetlands can be made with the species number, also called alpha diversity (Whittaker 1972). The wetland number 9 had the lowest species number (13 species, see also Table 7), whilst the number 4 had the highest alpha diversity (36 species). However, the relative diversity did not remain constant when considering the taxa at different levels (genera and families, Figure 6).
 |
 |
Figure
6. Taxonomic diversity profile of the studied wetlands. Figura 6. Perfiles de diversidad taxonómica de las lagunas estudiadas. |
Comparing the floristic composition between wetlands (beta diversity sensu Whittaker 1972), we found a high degree of dissimilarity. In the dendrogram resulting from the clustering analysis (Figure 7) we obtained 3 clusters at a distance of about 0.7; the first cluster consists of wetland 3 only, the second wetlands 8 and 9, and the third consists of the rest of the wetlands. However the last cluster shows a high degree of heterogeneity. We found no correlation between the distance between wetlands and their similarity (Figure 8).
Figure
7. Dendrogram of the agglomerative hierarchical cluster analysis
using complete linkage and the Jaccard-index as a similarity measure.
Figura 7. Dendrograma de la clasificación jerárquica usando el algoritmo "complete linkage" y el índice de Jaccard como medida de similitud. |
Figure
8. Floristic similarity between wetlands (pairwise comparison
by Jaccard-index) versus distance between compared wetlands. Figura 8. Similitud florística entre las lagunas (comparaciones pareadas usando el índice de Jaccard) en función a la distancia entre los humedales comparados. |
All of the regression models of the species number versus wetland area and number of present communities following the power model (Arrhenius 1921) were not significant, including the single models of wetland area (R2 = 0.029, p > 0.05) and number of communities (R2 = 0.322, p > 0.05) as well as the model including both parameters (R2 = 0.384, p > 0.05).
Ordination analysis
The wetlands in the ordination diagram (Figure 9) showed a high degree of dissimilarity according to their distribution. Extreme cases were represented by the wetlands number 3 and 8 that lie more separated from the rest of the wetlands. The distribution of the plant communities in the diagram also showed a high level of dispersion.
Figure
9. Ordination diagram of the temporary wetlands (o) using a non-metric
multidimensional scaling (nMDS) and the Bray-Curtis-index of dissimilarity.
Plant communities (+) and proportion of indicator plants (represented
as vectors) are added through post-hoc correlations. stress =
10.10. Abbreviation of the plant communities are shown in Table
1. Figura 9. Ordenación de las lagunas temporales (o) usando el método "non-metric multidimensional scaling" (nMDS) y el índice de disimilitud de Bray-Curtis. Las comunidades vegetales (+) así como también la proporción de plantas indicadoras (representadas por vectores) fueron agregadas usando correlaciones post-hoc. stress = 10,10. Las abreviaciones de las comunidades vegetales se presentan en el Cuadro 1. |
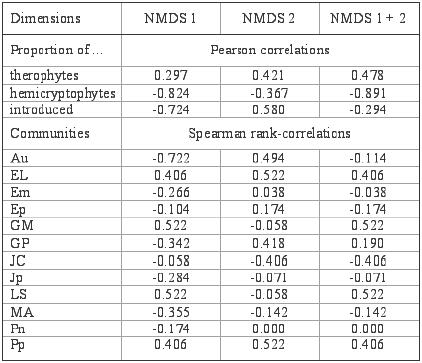
The proportion of therophyte, hemicryptophyte and adventive species were shown as vectors. The proportion of hemicryptophytes (see also Table 8) had the highest correlation with the ordination of the wetlands, whereas the lowest correlation was shown by the therophytes. Therophytes and hemicryptophytes were negatively correlated with each other; and they were poorly correlated with introduced species.
Table
8. Correlation coefficients between the ordination axes and the
proportion of therophytes, hemi-cryptophytes and introduced plants
in the vegetation and for the presence of plant communities in
the studied wetlands. Cuadro 8. Coeficientes de correlación entre las dimensiones de ordenación y la proporción de terófitas, hemicriptófitas y adventivas en la vegetación y la presencia de comunidades vegetales en las lagunas muestreadas. |
 |
|
Community abbreviations are shown in Table
1.
|
DISCUSSION
Wetland area and connectivity in the determination of species richness
As has been shown to be the case for Chilean grasslands (Oberdorfer 1960) and like Californian vernal pools (Barbour et al., 2005), the wetlands near Temuco were floristically poor. They reached a mean species density of only 8.4 species in 1,000 m2. Nevertheless, the area of the wetlands did not play an important role in the determination of the species number. Normally an analysis of the species-area relationship on a small scale results in low correlations, a phenomenon known as the small island effect (Lomolino y Weiser 2001). However, Alvarez (2008) reported a weak but significant correlation between species richness and area in smaller vernal pools (about 1.5 m2) near Temuco.
The fragmentation of this kind of habitat and the strong contrast of the environmental conditions with the surrounding upland (Holland y Jain 1981, Deil 2005) could result in a barrier for the dispersal between ponds. Moreover, seasonal wetland species normally have adaptations for restricted dispersal (Zedler 1990, Alvarez 2008). Under the scenario of restricted dispersal of species between wetlands, a higher floristic similarity was expected between wetlands closer together than between those further apart. This hypothesis was rejected as a result of the lack of correlation between distance and the similarity of the wetlands (Figure 8). An accidental dispersal of diaspores by water birds and livestock (diszoochory sensu Dansereau y Lems 1957) could produce a broad dispersal of the wetland species throughout the whole study area. Dispersal by epizoochorous mechanisms is not always restricted to diaspores with morphological adaptations such as hooks or viscous appendixes, as demonstrated by Ramírez et al., (2003) in Southern Chilean grasslands.
Within wetland diversity
As a part of this study, two aspects of the so called within wetland diversity were analysed: 1) The change in diversity over different taxonomic levels (species, genera and families; Feoli y Scimone 1984). 2) The vegetation mosaics present in each wetland (Barbour et al., 2003).
In the first case, different tendencies in the change of diversity across taxonomic levels were found. For example, wetland number 8 was the richest wetland at the family level (Figure 6), but not at the species level. Only wetland number 9 remained the poorest at all taxonomical levels.
In the second case, the presence of different communities within the wetlands was very variable (Table 7). Surprisingly the number of communities in the wetlands was not correlated with the species number. This variability was not only reflected in the number of communities but by the community composition of each wetland (details published by San Martín et al., 1998). Similar results have been obtained analysing Californian vernal pools at a larger geographic scale (Barbour≠ 2003).
Disturbance effects
Because all of the studied wetlands are anthropogenic in origin, all are the result of disturbance (deforestation). In addition, the seasonality in the environmental conditions that oscillate between the extremes of total drought and flooding could be interpreted as a natural disturbance, as it implies the frequent death of almost all of the aereal part of the vegetation (Deil 2005). A continual disturbance is provoked by the use of these wetlands as watering and grazing places. This factor could produce effects through grazing, trampling and eutrophication as a result of waste deposition in the wetlands. Manure transported from the surrounding cultivated areas has an additional effect that contributes to their eutrophication.
The high number of introduced species and their high frequency around the wetlands (e. g. Mentha pulegium, Leontodon taraxacoides and Polygonum persicaria; see also Table 3) indicate both the secondary anthropogenic origin and the strong disturbance effect of land use on these wetlands (Hauenstein et al. 1988, Ramírez et al., 1991).
The vectors used in the nMDS (Figure 9) as indicators of disturbance show a disturbance gradient from the right-bottom corner (low disturbance) to the left-top corner (high disturbance). According to this gradient, wetland number 3 has the lowest disturbance level, while wetlands number 10 and 7 have the highest level. At the high disturbance end of the gradient species number becomes also high, together with the importance of introduced species. These results contradict the findings of Ramírez et al., (1992), who observed a reduction in the species richness with disturbance. They also contradict the "intermediate disturbance hypothesis" (Connell 1978) that predicts a unimodal response by the species number (Grace 1999). But this interpretation does not represent a total agreement with the reality: wetland number 8, for example, is the only one with permanent water. On the other hand, wetland number 3 is intensively used as a watering place for cattle which implies a high level of eutrophication. According to our observations in 1996 and 1997, wetlands 3 and 9 endured a longer flooding period than the rest. Also, in wetland number 3 the aquatic plants reached their highest importance. Because of this, it is probable that the above-mentioned gradient in reality indicates a gradient of seasonality rather than disturbance, starting in the right-bottom corner (near to permanent flooding) moving to the left-top corner (near to terrestrial). This suggestion is confirmed by the location of the plant communities in the ordination diagram. Moreover, following Crow (1993), diversity increases as a response to an alternating wet-dry climate, explaining the increase in species number with seasonality in the ordination diagram.
The proportion of introduced species was directly correlated with alpha diversity (R2 = 0.716, p < 0.01), however, its effects on the beta diversity actually have an homogenization effect. The homogenization index of Qian y Ricklefs (2006) was calculated, making all possible pair-wise comparisons and calculating the Jaccard index of total species composition (Jtotal) and the composition of native species (Jnative). The homogenization index (H) results from the following formula: H = Jtotal - Jnative. About 60 % of all these comparisons had negative values (Figure 10), which indicates that there was a weak tendency to homogenization through introduced species.
Figure
10. Distribution of homogenization indices (H) among pairs of
wetlands. Black bars represent differentiation effect, while grey
bars represent homogenization effect. H classes: 1 (-0.15 to -0.1),
2 (-0.1 to -0.05), 3 (-0.05 to 0), 4 (0 to 0.05), 5 (0.05 to 0.1)
and 6 (0.1 to 0.5). Figura 10. Distribución de los índices de homogenización (H) comparando pares de lagunas. Las barras negras representan efectos de diferenciación, mientras que las barras grises representan efectos de homogenización. Clases de H: 1 (-0.15 a -0.1), 2 (-0.1 a -0.05), 3 (-0.05 a 0), 4 (0 a 0.05), 5 (0.05 a 0.1) y 6 (0.1 a 0.5). |
CONCLUSIONS
It is concluded that the area of the studied seasonal wetlands does not play any role in the determination of their species richness or the number of communities present in them. The within wetland diversity was also responsible for the high heterogeneity in the species compositions of the wetlands.
The floristic similarity between wetlands (beta diversity) was not related to the distance between them. This may be due to their heterogeneity and the lack of restrictions for broad dispersal of the plant species, at least at the geographical scale of this work.
It is difficult to estimate the effect of disturbance on the species richness using ecological indicators. In this study, the nMDS ordination did not reflect all aspects of disturbance in the ordination diagram, relating to the importance of hemicryptophytes, therophytes and introduced species. It is possible that factors not measured in this research, like seasonality and the nutrient content of soil and water, were also related to disturbance and important in the determination of the species composition of the wetlands.
Finally, the importance of introduced plants was directly correlated with the species richness of the wetlands; together they produced a weak homogenization of the species composition between wetlands.
The high importance of introduced species and the low amount of ephemeral wetlands specialists confirms their secondary, anthropogenic character.
ACKNOWLEDGEMENTS
This work was supported by Grant TS3*CT94-03535 from the E. C. and the Project F-95-06 from the research fund of the Universidad Austral de Chile. The authors are indebted to and wish to thank D. Allworth for help in the preparation of the manuscript. We also would like to thank anonymous referees for their valuable comments.
REFERENCES
ALVAREZ, M. 2008. Diasporenbank und Ökologie der Vegetation temporärer Gewässer im Cholchol-Gebiet (9. Region, Chile). J. Cramer, Berlin. Diss. Bot. 407: 87 p.
AMIGO, J.; RAMÍREZ, C. 1998. A bioclimatic classification of Chile: woodland communities in the temperate zone. Plant. Ecol. 136: 9-26.
ARRHENIUS, O. 1921. Species and area. J. Ecol. 9: 95-99
BARBOUR, M.G.; SOLOMESHCH, A.I.; WITHAM, C.W.; HOLLAND, R.F.; MACDONALD, R.L.; CILLIERS, S.S.; MOLINA, J.A.; BUCK, J.J.; HILLMAN, J.M. 2003. Vernal pool vegetation of California: variation within pools. Madroño 50: 129-146.
BARBOUR, M.G.; SOLOMESHCH, A.I.; HOLLAND, R.F.; WITHAM, C.W.; MACDONALD, R.L.; CILLIERS, S.S.; MOLINA, J.A.; BUCK, J.J.; HILLMAN, J.M. 2005. Vernal pool vegetation of California: communities of long-inundated deep habitats. Phytocoenologia 35: 177-200.
BERNINGER, O. 1929. Wald und offenes Land in Süd-Chile. J. Engelhorns, Stuttgart. Geogr. Abh. 3: 130 p.
BESOAIN, M. 1985. Los suelos. In: Tosso, J. (ed.) Suelos volcánicos de Chile. INIA, Santiago. pp: 1-107.
BLISS, S.A.; ZEDLER, P.H.; KEELEY, J.E.; ARROYO, M.T.K. 1998. A floristic survey of the temporary wetlands in the Mediterranean-climate region of Chile. In: McComb, A.J.; Davis, J.A. (eds.). Wetlands for the future. Gleneagles, Adelaide. pp: 219-228.
BRAY, J.R.; CURTIS, J.T. 1957. An ordination of the upland forest communities of southern Wisconsin. Ecol. Monogr. 27: 325-349.
BRUMMITT, R.K.; POWELL, C.E. 1992. Authors of plant names. Kew Royal Botanic Gardens. 732 p.
CHAMBERS, P.A.; LACOUL, P.; MURPHY, K.J.; THOMAZ, S.M. 2008. Global diversity of aquatic macrophytes in freshwater. Hydrobiologia 595: 9-26.
CONNELL, J.H. 1978. Diversity in tropical rain forests and coral reefs. Science 199: 1302-1310.
CROW, G.E. 1993. Species diversity in aquatic angiosperms: latitudinal patterns. Aquat. Bot. 44: 229-258.
DANSEREAU, P.; LEMS, K. 1957. The grading of dispersal types in plant communities and their ecological significance. Institut Botanique de l'Université de Montréal. 52 p.
DEIL, U. 2005. A review on habitats, plant traits and vegetation of ephemeral wetlands - a global perspective. Phytocoenologia 35: 533-705.
DI CASTRI, F.; HAJEK, E.R. 1976. Bioclimatología de Chile. Santiago, Universidad Católica de Chile. 129 p.
DIERSCHKE, H. 1994. Pflanzensoziologie. Stuttgart. Eugen Ulmer, 683 p.
ELLENBERG, H., MUELLER-DOMBOIS, D. 1966. A key to Raunkiaer plant life forms with revised subdivisions. Ber. Geobot. Inst. ETH, Stift. Rübel 37: 56-73.
FEOLI, E., SCIMONE, M. 1984. Hierarchical diversity: an application to broad-leaved woods of the Apennines. Giorn. Bot. Ital. 118: 1-15.
GRACE, J.B. 1999. The factors controlling species density in herbaceous plant communities: an assessment. Perspect. Plant. Ecol. 2: 1-28.
GRILLAS, P.; GAUTHIER, P.; YAVERCOVSKI, N.; PERENNOU, C. 2004. Mediterranean temporary pools. Station biologique de la Tour du Valat, Le Sambuc, vol. 1, 119 p.
HAJEK, E.R.; DI CASTRI, F. 1975. Bioclimatografía de Chile. Santiago, Universidad Católica de Chile. 107 p.
HAUENSTEIN, E.; RAMÍREZ, C.; LATSAGUE, M.; CONTRERAS, D. 1988. Origen fitogeográfico y espectro biológico como medida del grado de intervención antrópica en comunidades vegetales. Medio Ambiente 9: 140-142.
HAUENSTEIN, E.; GONZÁLEZ, M.; PEÑA-CORTÉS, F.; MUÑOZ-PEDREROS, A. 2002. Clasificación y caracterización de la flora y vegetación de los humedales de la costa de Toltén (IX Región, Chile). Gayana Bot. 59: 87-100.
HOLLAND, R.F.; JAIN, S.K. 1981. Insular biogeography of vernal pools in the central valley of California. Am. Nat. 117: 24-37.
JACCARD, P. 1912. The distribution of the flora in the Alpine zone. New Phytol. 11: 37-50.
KIRSCHNER, J. 2002. Species Plantarum (Juncaceae). Australian Biological Resources Study, Canberra, vols. 7-8.
KRUSKAL, J.B. 1964. Nonmetric multidimensional scaling: a numerical method. Psychometrika 29: 115-129.
LEYER, I.; WESCHE, K. 2007. Multivariate Statistik in der Ökologie. Springer Berlin. 221 p.
LOMOLINO, M.V.; WEISER, M.D. 2001. Towards a more general species-area relationship: diversity on all islands, great and small. J. Biogeogr. 28: 431-445.
MACARTHUR, R.H.; WILSON, E.O. 1967. The theory of island biogeography. Lamarks in Biology, Princeton. 203 p.
MARTICORENA, C.; QUEZADA, M. 1985. Catálogo de la flora vascular de Chile. Gayana Bot. 42: 1-147.
MATTHEI, O. 1995. Manual de las malezas que crecen en Chile. Santiago. Alfabeta 545 p.
OBERDORFER, E. 1960. Pfanzensoziologische Studien in Chile. J. Cramer, Weinheim. Flora et Vegetatio Mundi 2: 208 p.
OTERO, L. 2006. La huella del fuego, historia de los bosques nativos, poblamiento y cambios en el paisaje del sur de Chile. Santiago. Pehuén 171 p.
POTT, R.; REMY, D. 2000. Gewässer des Binnenlandes. Stuttgart, Eugen Ulmer. 255 p.
QIAN, H.; RICKLEFS, R.E. 2006. The role of exotic species in homogeneizing the North American flora. Ecol. Lett. 9: 1293-1298.
RAMÍREZ, C. 1984. Einfluss der Jahreszeit auf Vegetationsaufnahmen von Rasengesellschaften mit Thero- und Geophyten. In: Knapp, R. (ed.). Sampling methods and taxon analysis in vegetation science. Hague, Dr. W. Junk. pp: 181-183.
RAMÍREZ, C.; FERRIERE, F.; FIGUEROA, H. 1983. Estudio fitosociológico de los bosques pantanosos templados del sur de Chile. Rev. Chil. Hist. Nat. 56: 11-26.
RAMÍREZ, C.; ALVAREZ, M.; SAN MARTÍN, C. 2003. Diásporas y mecanismos de dispersión en praderas antropogénicas de la X Región de Los Lagos, Chile. Revista Geográfica de Valparaíso 34: 203-218.
RAMÍREZ, C.; SAN MARTÍN, C.; CONTRERAS, D. 1998. Diversidad florística y vegetacional pratense en vegas, colinas y serranías al poniente de Temuco, Chile. Ciencia e Investigación Agraria 25: 27-50.
RAMÍREZ, C.; SAN MARTÍN, C.; MAC DONALD, R. 1992. El paisaje vegetal como indicador de cambios ambientales. Ambiente y Desarrollo 8: 67-71.
RAMÍREZ, C.; SAN MARTÍN, C.; OJEDA, P. 1997. Muestreo y tabulación fitosociológica aplicados al estudio de los bosques nativos. Bosque 18: 19-27.
RAMÍREZ, C.; FINOT, V.; SAN MARTÍN, C.; ELLIES, A. 1991. El valor indicador ecológico de las malezas del centro-sur de Chile. Agro Sur 19: 94-116.
RAMÍREZ, C.; HAUENSTEIN, E.; CONTRERAS, D.; SAN MARTÍN, J. 1988. Degradación de la vegetación en la depresión intermedia de la Araucanía, Chile. Agro Sur 16: 1-14.
RAMÍREZ, C.; SAN MARTÍN, C.; CONTRERAS, D.; SAN MARTÍN, J. 1994. Estudio fitosociológico de la vegetación pratense del valle del río Chol-Chol (Cautín, Chile). Agro Sur 22: 41-56.
RAMÍREZ, C.; SAN MARTÍN, J.; HAUENSTEIN, E.; CONTRERAS, D. 1989. Estudio fitosociológico de la vegetación de Rucamanque (Cautín, Chile). Studia Botanica 8: 91-115.
R DEVELOPMENT CORE TEAM. 2005. R: a language and environment for statistical computing. R Foundation for Statistical Computing, Viena. http://www.R-project.org
RIVAS-MARTÍNEZ, S. 1993. Bases para una nueva clasificación bioclimática de la tierra. Universidad Complutense de Madrid. Folia Bot. Matritensis 10: 23 p.
SAN MARTÍN, J.; RAMÍREZ, C. 1986. Los bosques de ruil de Chile central: sus especies vegetales y sus formas de vida. Maule UC 10: 85-91.
SAN MARTÍN, C.; RAMÍREZ, C.; OJEDA, P. 1998. La vegetación de lagunas primaverales en las cercanías de Temuco (Cautín, Chile). Acta Bot. Malacitana 23: 99-120.
SCHMITHÜSEN, J. 1956. Die räumliche Ordnung der chilenischen Vegetation. In: Troll, C.; Bartz, F.; Hahn, H. (eds.). Forschungen in Chile. Geographisches Institut der Universität Bonn. pp: 1-86.
SCULTHORPE, C.D. 1967. The biology of aquatic vascular plants. London, Edward Arnold. 610 p.
TUTIN, T.; BURGES, N.; CHATER, A.; EDMONSON, J.; HEYWOOD, V.; MOORE, D.; VALENTINE, D.; WALTERS, S.; WEBB, D. 1996. Flora Europaea UK, Cambridge University, 5 vols.
WHITTAKER, R.H. 1972. Evolution and measurement of species diversity. Taxon 21: 213-251.
WOODLAND, D.W. 1991. Contemporary plant systematics. New Jersey, Prentice Hall. 582 p.
ZEDLER, P.H. 1990. Life histories of vernal pool vascular plants. In: Ikeda, D.H.; Schlising, R.A. (eds.). Vernal pool plants - their habitat and biology. Herbarium CSU Chico, California, pp: 123-146.
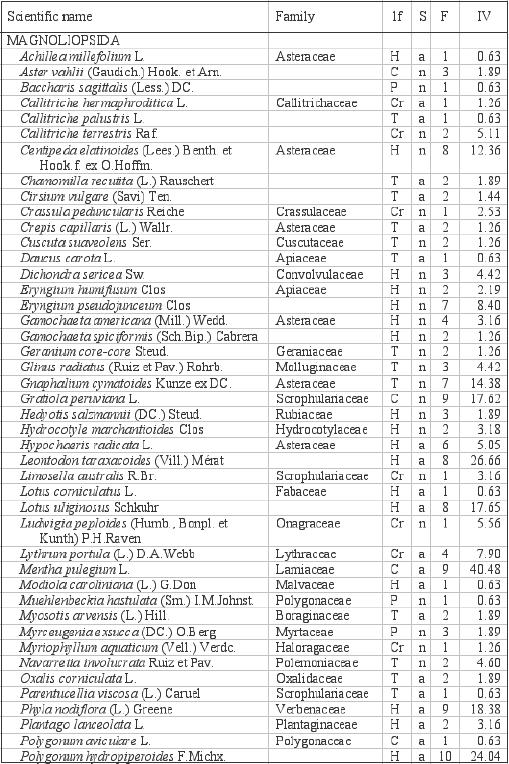
Appendix:
Scientific names, families, life-forms (lf), status (S), frequencies
in the pools (F), and importance values (IV) of the flora of the
anthropogenic vernal pools (Temuco, Chile). |
 |
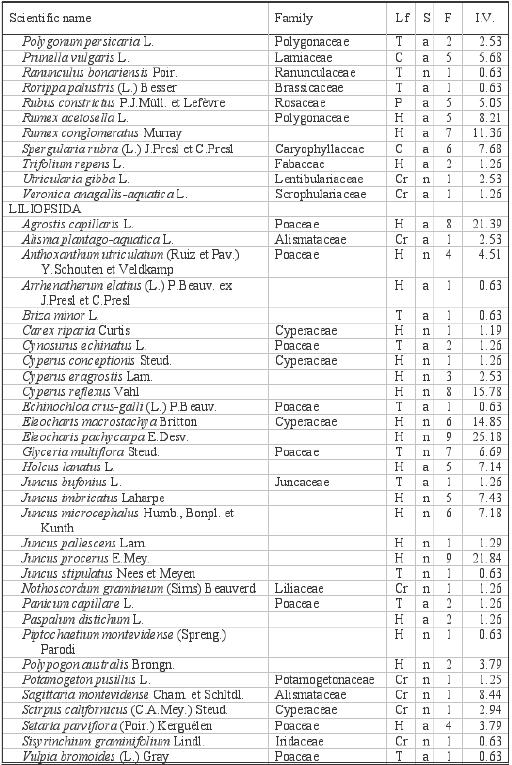
| Appendix (continuation) |
 |
|
Life forms: phanerophytes (P), chamaephytes (C), hemicryptophytes (H), cryptophytes (Cr) and therophytes (T). Status: natives (n), introduced (a) |
Recepción de originales: 11 de diciembre de 2008